The Mineral Resource and Ore Reserve for the Steelpoortdrift Vanadium Project was updated on 4th October 2022.
The global Mineral Resource estimate is 680Mt of Measured, Indicated and Inferred Mineral Resources at an average in situ grade of 0.70% V2O5, when a cut-off grade of 0.45% V2O5 is applied. This provides for 4.74Mt of contained V2O5 (refer Table 1 below) and at the DFS throughput rates would allow for over 180 years of mining.
Table 1: Mineral Resource Estimate (as at 30 April 2022)
Source: Sound Mining, 2022
Notes:
· Stated at a cut-off grade of 0.45% V2O5;
· The Mineral Resources are stated on a 100% attributable basis for VanRes, of which VR8 owns 86.49%;
· The Mineral Resources are inclusive of Ore Reserves; and
· Reported in-situ with any apparent computational errors due to rounding not considered significant.
About the Orebody
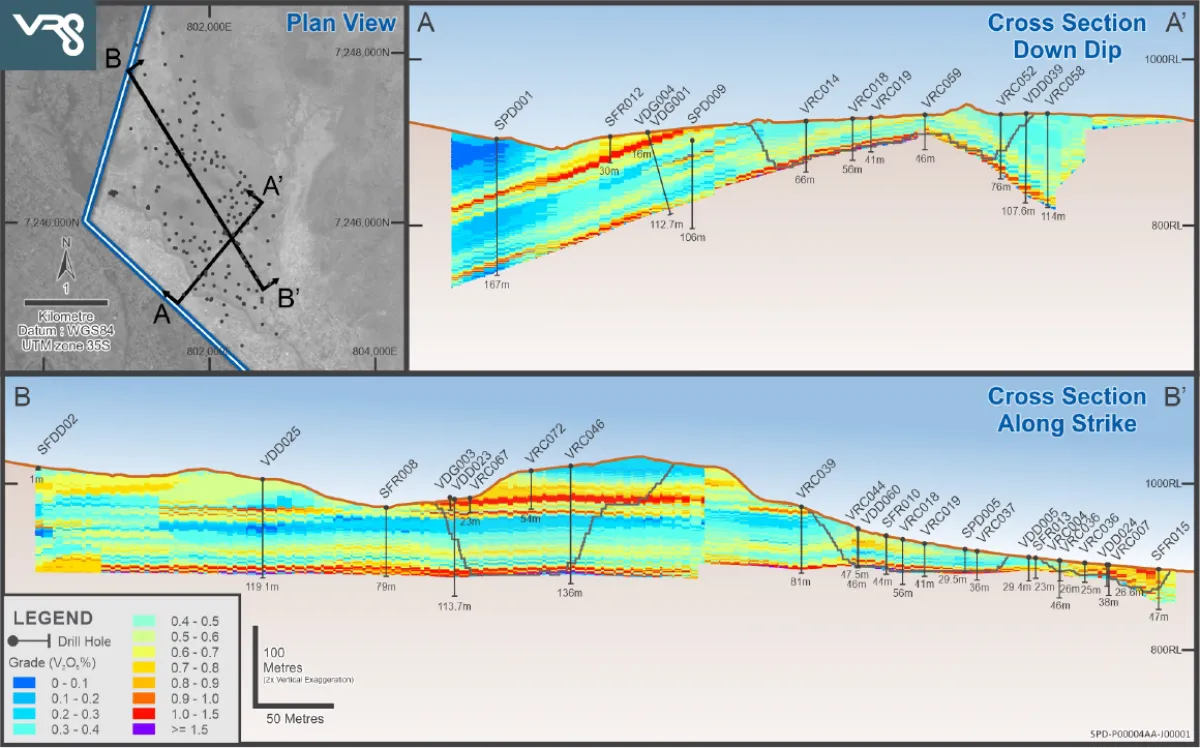
As seen in the image above, the orebody outcrops at the surface in multiple places across the site and then dips shallowly (~10-12⁰) which allows for open pit mining with a very low strip ratio (0.88x waste : ore) for the 25-year Life of Mine presented in the DFS.
Figure 1 below highlights the shallow nature of the resource as well as showing three key high grade vanadiferous titanomagnetite seams that are rich in V2O5, these are represented by the yellow and red bands.
A key advantage of the Steelpoortdrift orebody is its ability to achieve a high-grade concentrate of greater than 2% V2O5, which is very competitive with current Vanadium producers and one of the highest concentrate grades for any Vanadium projects globally. The high concentrate grade allows for greater recoveries, lower throughput rates and ultimately, lower operating costs than many other Vanadium projects globally.
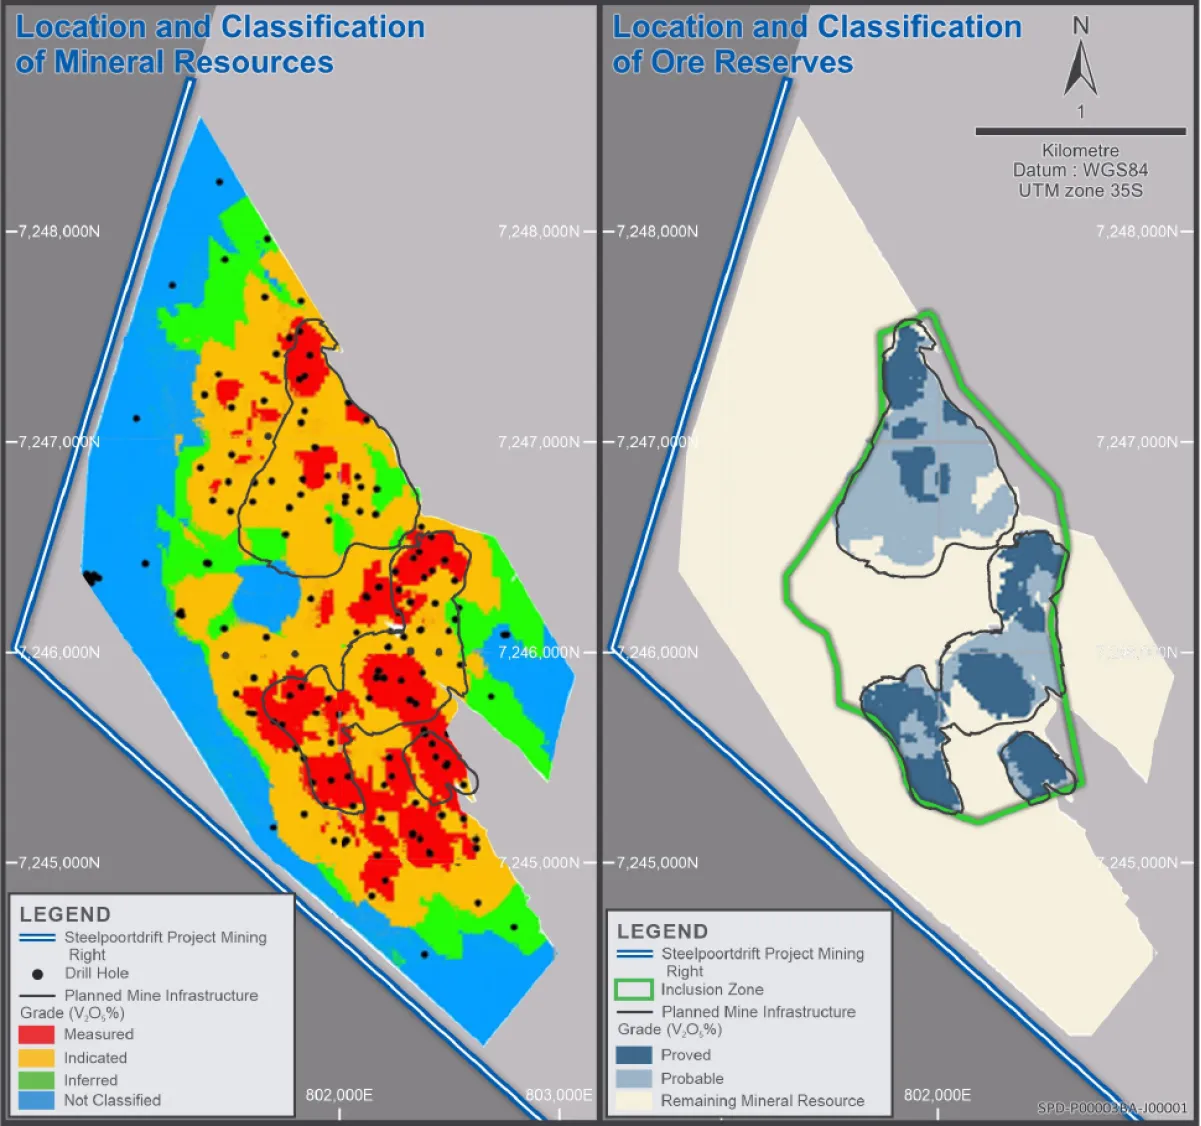
The DFS and latest Mineral Resource update both flagged that future target areas for infill drilling have been identified down dip from the current Resource to further expand the deposit.
Figure 2 shows the current location and classification of Mineral Resources and Ore Reserves, with the blue areas on the left-hand side representing the unclassified resource areas, which with further drilling may be able to be classified as part of the Mineral Resource.
Figure 1 Cross Sections indicating grade variations along strike and down dip